 Pat Heffernan
Oops! How to Prevent Bad News Results When the Media Calls
A media call feels urgent — but it usually isn’t. Taking a few minutes to get your bearings can be the difference between a quote you’re proud of and...
While officially this is the second in a series of posts about changing minds and message framing, you may be interested because it can also be considered either a confessional about numbers, a bias for whole-brain thinking, or a how-to use social math to illustrate the need for change.
You see, I’ve never quite understood the Berlin wall between numbers and words. Perhaps, like me, as a word lover you learned at an early age you were supposed to hate numerical figures and anything connected to prime numbers. Whether or not math anxiety is culturally induced, there is no doubt that it is real for many people.
Neuroimaging studies, [they] pointed out, have revealed the powerful brain response a geometry quiz can trigger. The anticipation of a math problem "is neurally equivalent to the anticipation of physical harm in adults.” -- Researchers from the University of Missouri, the University of California at Irvine and the University of Glasgow, Journal PLOS One
Thankfully, numbers seem to be simply another language to me, a different way of communicating. So early in my career, when asked to prepare a budget for a nonprofit employer, I approached the numbers as a story about our annual goals simply stated in numerical terms.
More recently, I’ve been thrilled by the increased prevalence of infographics and data-driven visuals, because when well done, they demonstrate that numbers can tell stories too. Yet many people continue to have difficulty assimilating data, especially large numbers, or numbers in an unfamiliar unit of measurement.
Large raw numbers may prove a point to statisticians, but others need more context to understand the meaning of the information. That's where social math comes in.

Social math is a simple way to make data that includes large numbers easier to grasp by relating it to things that we already understand. It is an analogy based on numbers. It is a tool to combine the emotional impact of stories with the power of data. It is a way of presenting numbers in a real-life, familiar context to help people see the story behind them.
In an earlier post, I wrote about the reality that “facts are not what change peoples’ minds.” The same is true for facts expressed as numbers or data. This may explain why many change agents have moved to telling stories. Stories work because their narrative helps people connect new information to what they already know.
By relating the unfamiliar to the familiar, we can figure out the relevance and meaning of the new information that bombards us every day. Yet stories can also trigger dominant frames, or mental shortcuts, that let us avoid dealing with the need for change. Social math is a tool that can help people connect new information to what they already know, without triggering the status quo or dominant frame.
In a post on social math on her blog, ImpactMax, Gayle Thorsen offered a number of examples, some taken from Making Numbers Count by Sightline Institute, known for its use of social math on the climate change issue.
The Berkley Media Studies Group offers a number of examples of social math used well in text alone or with graphics, as well as five tips on "Using social math to support public health policy." My favorite example is the one on gun violence.
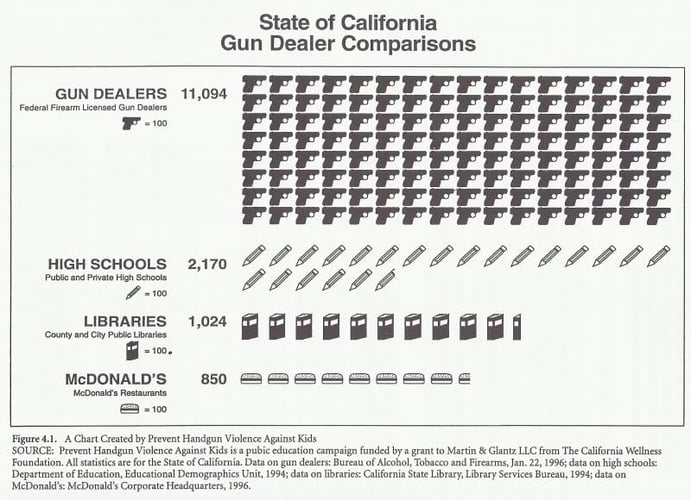
Here's an excerpt from how BMSG describes the story this graphic tells:
... from advocates concerned about gun violence, who, in 1996, found that there were more than 11,000 gun dealers in the state of California. In a creative use of social math that remains relevant today, they put the issue into context by creating a chart showing the number of gun dealers in comparison to the state's McDonald's (850), high schools (2,170), and libraries (1,024). This brought the issue of gun availability to life: McDonald's restaurants seemed to be everywhere, but there were more than 10 times as many firearms dealers.
Closer to home, here is the first draft of a social math image eventually used to help explain the high cost of early child care in Vermont. (Sponsor and call-to-action yet to be added.)

Finding these kinds of analogies for your statistics takes some time, but it makes your messaging much more effective. Think creatively about how you can capture the scale of things by comparing them to things of a more familiar size.
This kind of research is much easier in the internet age. Two sites I find helpful are: WolframAlpha for comparisons of units of measure, and the EarthClock for global energy and environmental issues.
Two important points. First, use social math carefully. You have to be able to defend the way you’re using any data, so make sure all your numbers and comparisons are accurate. You don’t want to make overstatements or repeat crisis images. Second, don’t overuse this tool. Less is more. Often, one piece of data conveyed through social math is more memorable and persuasive than six pieces of data.
For those of you interested in learning more about the subtleties of using social math, read Frameworks Institute’s Wide Angle Lens, a free online learning module available at www.frameworksacademy.org. A short course on Framing with Numbers is also available.
And for those of you interested in continuing to explore how message framing and social change interact, subscribe above by email or stay connected below.

----
Photo credit: Numbers, Creative Commons license 2.0
Editor's note: This post was originally published in October of 2010 and has been updated to include new information recent examples.
![]()

The Change Conversations blog is where changemakers find inspiration and insights on the power of mission-driven communication to create the change you want to see.
© 2009- to present, Marketing Partners, Inc. Content on the Change Conversations blog is licensed under a Creative Commons Attribution-Noncommercial-NoDerivs 3.0 United States License to share as much as you like. Please attribute to Change Conversations and link to ChangeConversations.
Creative Commons License may not apply to images used within posts and pages on this website. See hover-over or links for attribution associated with each image and licensing information.

A media call feels urgent — but it usually isn’t. Taking a few minutes to get your bearings can be the difference between a quote you’re proud of and...
Think your communication is always bias-free? Think that you are equally respectful, inclusive and welcoming with a diverse range of people — those...

For the last few decades, but especially so in recent years, people are seeking out more than just an income from their place of employment. More...