 Pat Heffernan
Oops! How to Prevent Bad News Results When the Media Calls
A media call feels urgent — but it usually isn’t. Taking a few minutes to get your bearings can be the difference between a quote you’re proud of and...

Last week in a client meeting I was asked a string of marketing questions that I have been asked many times before.
“Is that a good open rate, a good click-through rate?”
“How much do others spend on digital advertising?”
“How are we doing compared to your other clients?”
What’s behind these questions are deeper issues—questions that everyone who works in a mission-driven organization wrestles with from time to time—“Are our results sweet or just so-so?” “Are we doing a good job?” Or more formally, how do we benchmark our marketing performance?
Even when you know exactly where you want to go because you are marketing with SMART goals and objectives, this can be a difficult question to answer. One reason is that often there is little relevant marketing benchmark data available for you to compare with your organization, its mission, and its key performance indicators, or KPIs.
A Key Performance Indicator (KPI) is a measure for evaluating how well an organization is achieving its stated goals and objectives. Ideally, these are the agreed-upon metrics you identified for each of the SMART objectives in your marketing plan. Yet even if you are dutifully collecting, recording, and reporting your marketing metrics regularly, you may lack the context to evaluate how well you are performing. That’s where benchmarks come in.
A Key Performance Indicator (KPI) is a measure or metric for evaluating how well an organization is achieving its stated goals and objectives.
Merriam-Webster tells us that a benchmark is “something that serves as a standard by which others may be measured or judged” or “a point of reference from which measurements may be made.” A benchmark provides the evidence you need to influence your team, board, or investors. Evidence is vital to back up a case for change and even more powerful when internal data can be compared with data from top performing or so-called “best in class” organizations.
A benchmark is a reference point that helps you compare your levels of performance with the performance levels of competitors, other companies, or industry best practices.
Benchmarks help you establish the appropriate targets and performance thresholds for your KPIs so you know if you are on track or not.
For example, if your company has a goal of providing stellar customer service, you might decide to use the Net Promoter Score (NPS) as your Key Performance Indicator. NPS is a commonly used metric based on answers to the question ‘How likely are you to recommend our service / product to a friend?’ You would collect benchmarks of NPS scores of your competitors as well as your industry to set the right target and put your performance into perspective. There are several websites that offer NPS benchmark scores for multiple industries.
In addition to industry, you may decide you need to consider organization size and country for meaningful context. HubSpot, for example, recently shared the story of its journey to identify the variance it observed in its NPS score based on geographic region.
Your definition of success may look different from anyone else’s, so sometimes tracking the default KPIs isn't enough.
“Remember: KPIs should be the best of the best metrics and indicators for your success.” – Neil Patel
When searching for standards, remember you are seeking what is often referred to as the 3Rs of good benchmarking: relevant, reliable, and realistic. Here are the three types of benchmarks I hear the most about from clients.
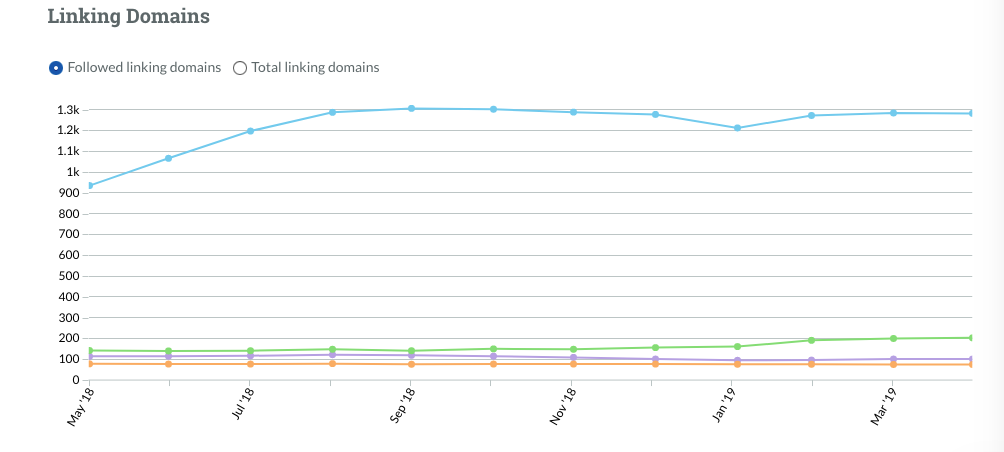
Even the smallest nonprofit will have historical data. Whether you’re looking at average website traffic, social media engagement, or the return on your development emails, historical data provides a starting point for evaluating current performance.
Start with averages from past years’ reports and a simple goal to move up and to the right. You can factor in anomalies you know about budget changes, major donations, and even seasonality to determine when to set more aggressive targets — and when not to. 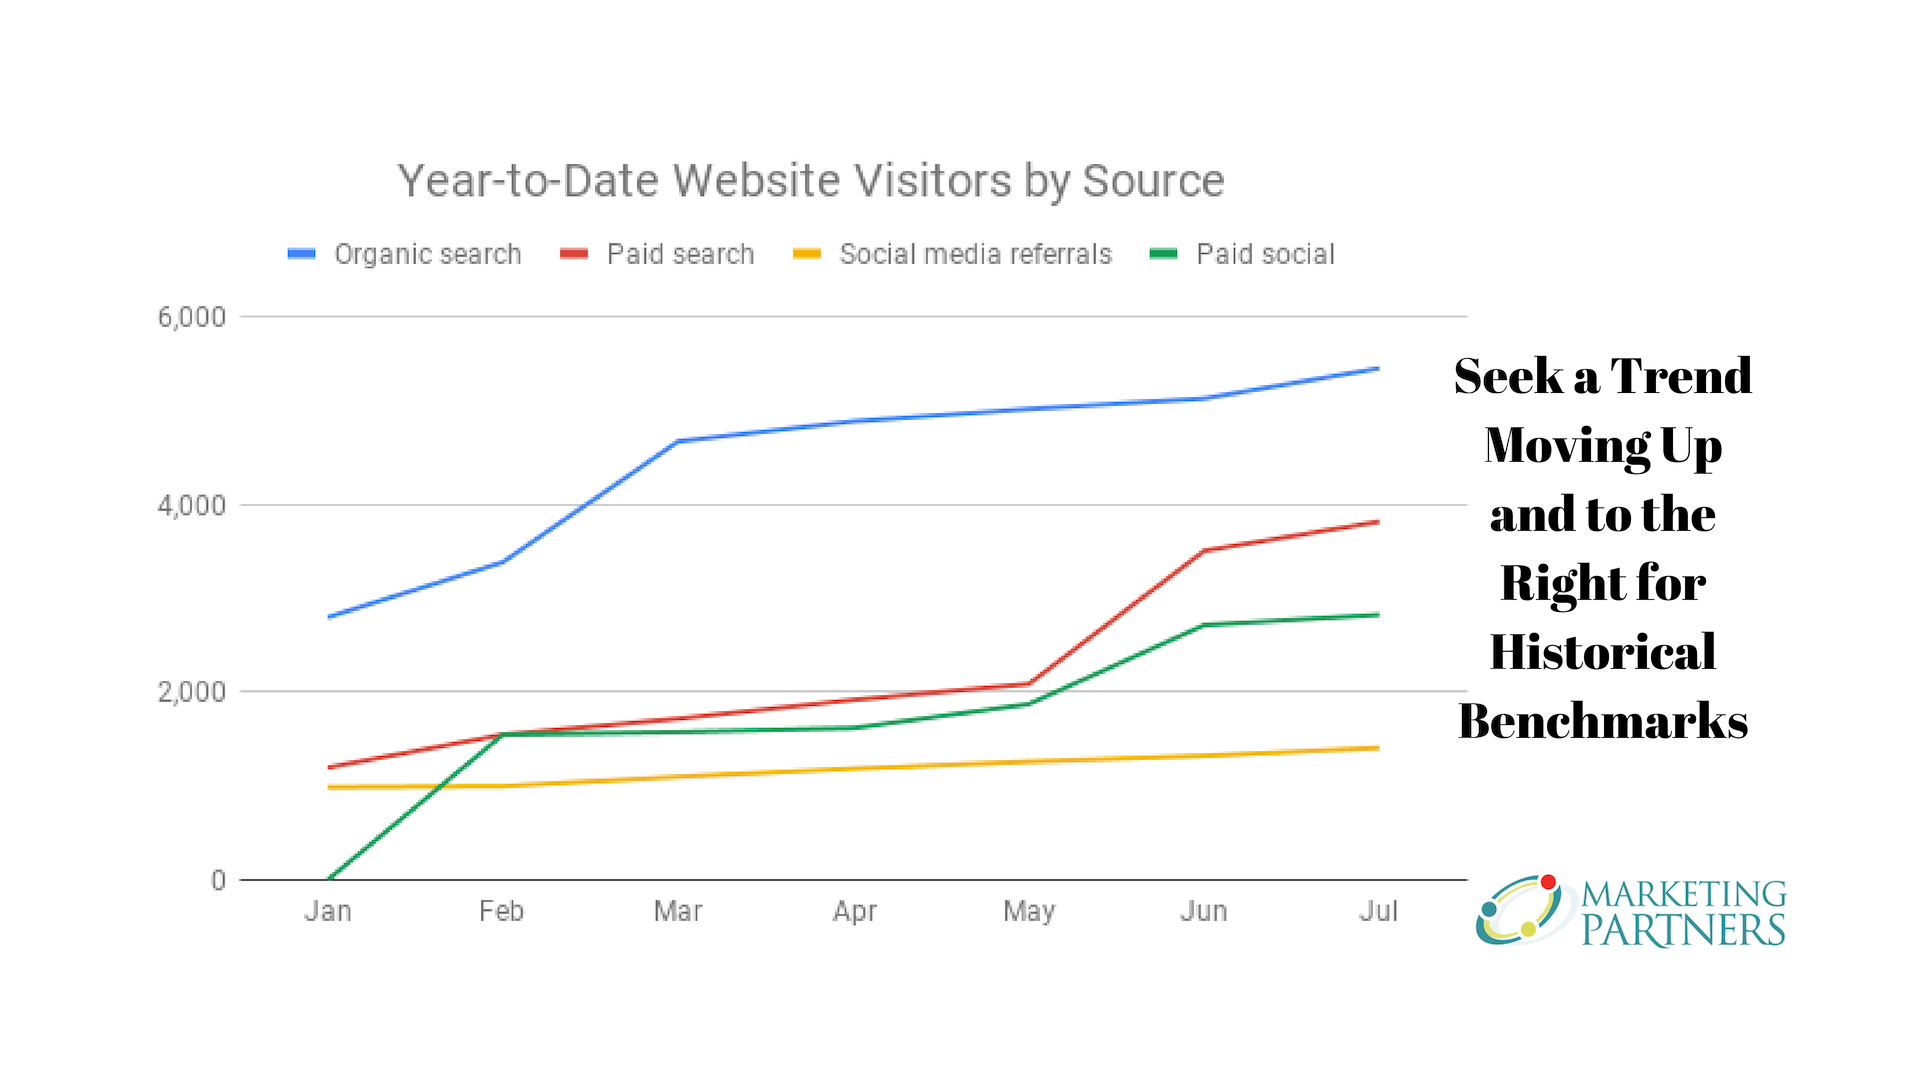
Using only historical benchmarks can increase your risk of missing major industry or market shifts. Your organization may be seeing a 2-3 percent annual increase in website traffic but what if your competitors are enjoying a 15 percent increase because they have adopted innovative technologies? So, once you’ve got your historical benchmarks established, you can move on to look at competitors and industry groups to see where your performance lands in the wider digital marketing landscape.
Every organization has competitors (or alternatives to the behavior you are seeking to change), so a benchmark tactic looks directly at your competitors to not only improve your internal operations but also understand your competitors better.
We all want to know where we stand against the competition. An agency specializing in digital marketing or one of several tools can give you data on competitor keywords, pay-per-click (PPC) advertising campaigns, and overall website performance. SEMrush, Moz, Ahrefs, and Ubersuggest are four popular tools.
Other competitor metrics are harder to come by than others. Although the data may not be the most current, SEO and social media-driven data are available publicly. But many of the more valuable key performance indicators such as conversion rates, ROI, or lifetime customer value, will be next-to-impossible to find.
Another risk of competitive benchmarking is the potential for faulty comparisons. If you are a single-product company, benchmarking your website traffic against an established brand that offers a range of products is unrealistic.
Competitive benchmarks offer valuable insights about your market challengers. But they may not be the best points of comparison if you require data that isn’t public or lack “apples-to-apples” competitors.
Industry benchmarks compare performance metrics to the best in the industry from other companies and organizations. Once again though, comparing yourself to others may not be the best benchmarking strategy.
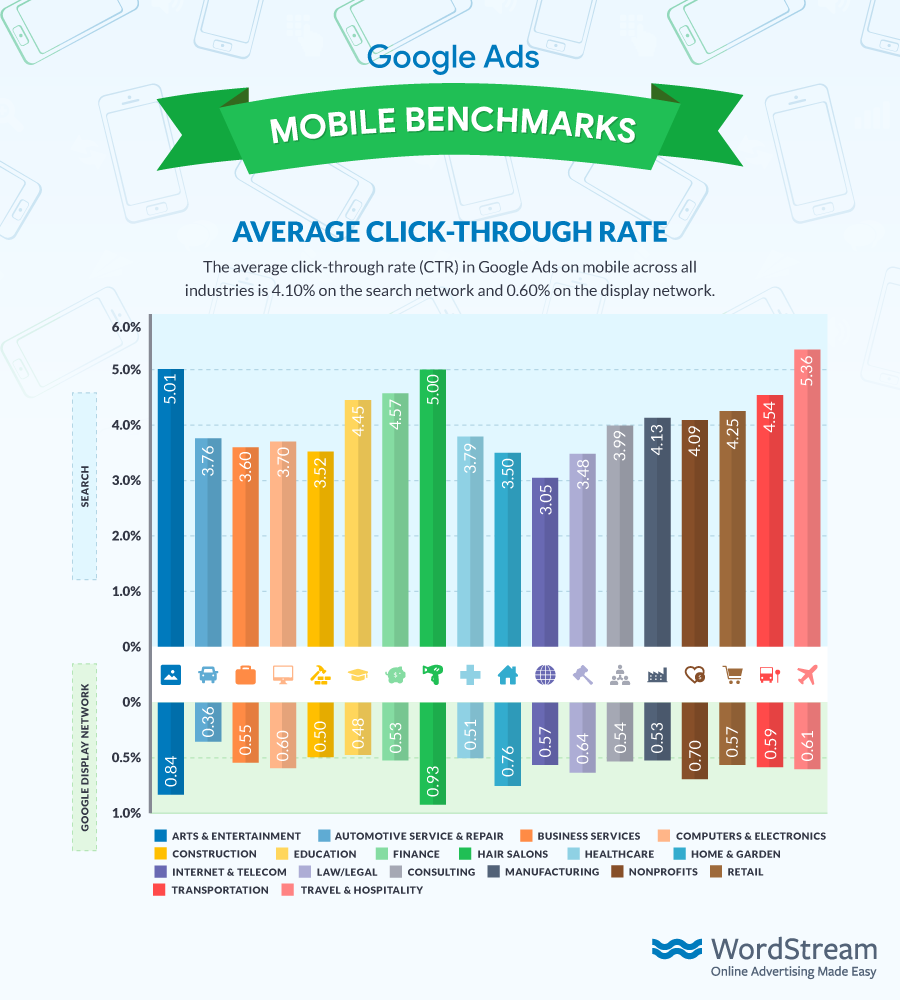
Look at the wide range of Mobile Ad Click-Through Rates within some industries. You need context to know where to place your organization.
MailChimp and Constant Contact regularly publish lists of their customers’ average email metrics, segmented by industry. But again, before you match it and your email campaign performance, consider millions of organizations in their customer bases. Their results may be too broad to provide meaningful benchmarks to niche businesses or nonprofits even when you break their data down by industry.
For example, the education category for these general email service providers may include an average ranging from elite universities emailing prospective undergrads to truck driving schools offering commercial driver's licenses to locals. None of which has anything thing in common with your private nonprofit boarding school and its community of family and education consultant subscribers.
Depending on your industry, a valuable source of industry (and sometimes competitor) data may be a specialized trade association or group. Returning to the education category and a private nonprofit boarding school as an example, the National Association of Independent Schools offers DASL (Data Analysis and School Leadership) to help its members benchmark their performance against other comparable education institutions.
In general, industry benchmarks are a useful way to judge how your digital marketing efforts are doing. But be sure to examine if you are evaluating yourself against actual peers.
Ask yourself which measures will shift your focus toward. This will vary based on your type of organization and specific objectives, but it’s critical to ensure your marketing metrics and selected benchmarks are directly tied to organizational outcomes — e.g., online visibility, employee recruitment conversions, or marketing-attributed revenue.
Once you’ve developed metrics, set up processes for tracking and make sure you have people equipped to properly analyze the data. Be realistic. As a short-staffed client in the government and public sector told me once when we were discussing expanding their digital marketing metrics: “Unless it collects itself, it won’t happen.”
Spread the word. If every member of your marketing team (and beyond) understands what the metrics are and why it’s valuable to prioritize them, you are more likely to find motivation to reach your goals will increase.
Apply it. Use what you learn on a monthly, quarterly, or at least annual basis to document your successes, refine your strategies and tactics, drop what’s not working, and identify new opportunities for your marketing efforts to advance your mission.
Compare up to 10 websites: Google Mobile Speed Scorecard
Google Ads Benchmarks for YOUR Industry [Updated], WordStream
NPS Benchmarks for Multiple Industries, CustomerGauge
Lessons Learned from Measuring International Customer Satisfaction, HubSpot
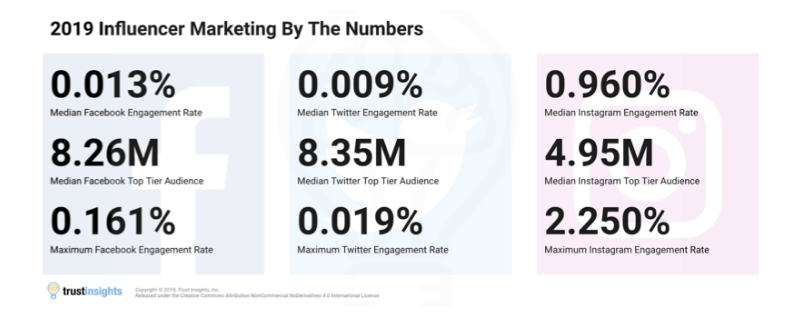
2019 Social Media Influencer Benchmarks, TrustInsights
Google Ads Mobile Benchmarks for 18 Industries [Infographics] (MarketingProfs)
Nonprofit Benchmarks 2018 [PDF], M+R and Nonprofit Tech for Good
YouTube Advertising Benchmark Report (StrikeSocial)
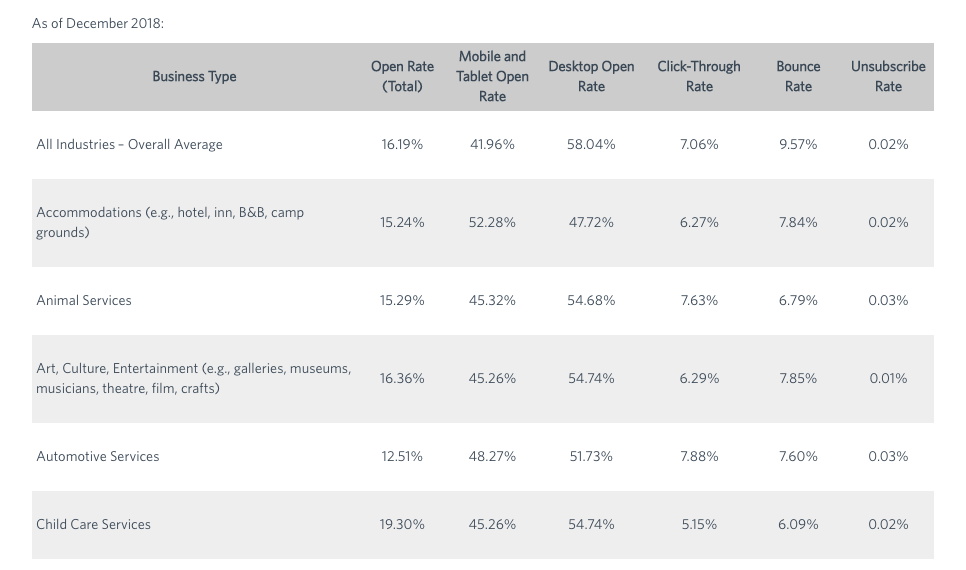
Constant Contact: Average Industry Rates for Email as of December 2018
MailChimp Email Marketing Benchmarks
![]()

The Change Conversations blog is where changemakers find inspiration and insights on the power of mission-driven communication to create the change you want to see.
© 2009- to present, Marketing Partners, Inc. Content on the Change Conversations blog is licensed under a Creative Commons Attribution-Noncommercial-NoDerivs 3.0 United States License to share as much as you like. Please attribute to Change Conversations and link to ChangeConversations.
Creative Commons License may not apply to images used within posts and pages on this website. See hover-over or links for attribution associated with each image and licensing information.

A media call feels urgent — but it usually isn’t. Taking a few minutes to get your bearings can be the difference between a quote you’re proud of and...
Think your communication is always bias-free? Think that you are equally respectful, inclusive and welcoming with a diverse range of people — those...

For the last few decades, but especially so in recent years, people are seeking out more than just an income from their place of employment. More...